 copyright: OBK und GreenAdapt
Maps for Climate Change Adaptation
This page was translated from German using artificial intelligence. The translation may contain errors or inaccuracies. In case of doubt, the German original version prevails.
As part of the Intermunicipal Climate Change Adaptation Concept for the Oberbergischer Kreis (KWAK), maps on heat stress, cold air generation, and cold air volume were created.
These, together with the maps of the heavy rain risk management, form a planning basis for citizens, businesses, and municipalities to effectively adapt to the impacts of climate change.
The following maps can be found in the RIO Spatial Information Oberberg.
Heat Hazard Map
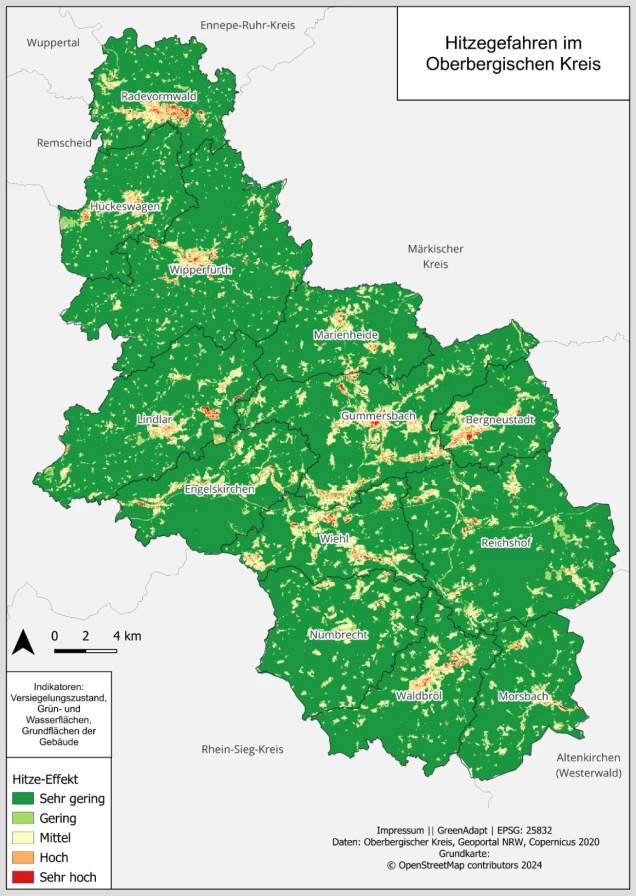
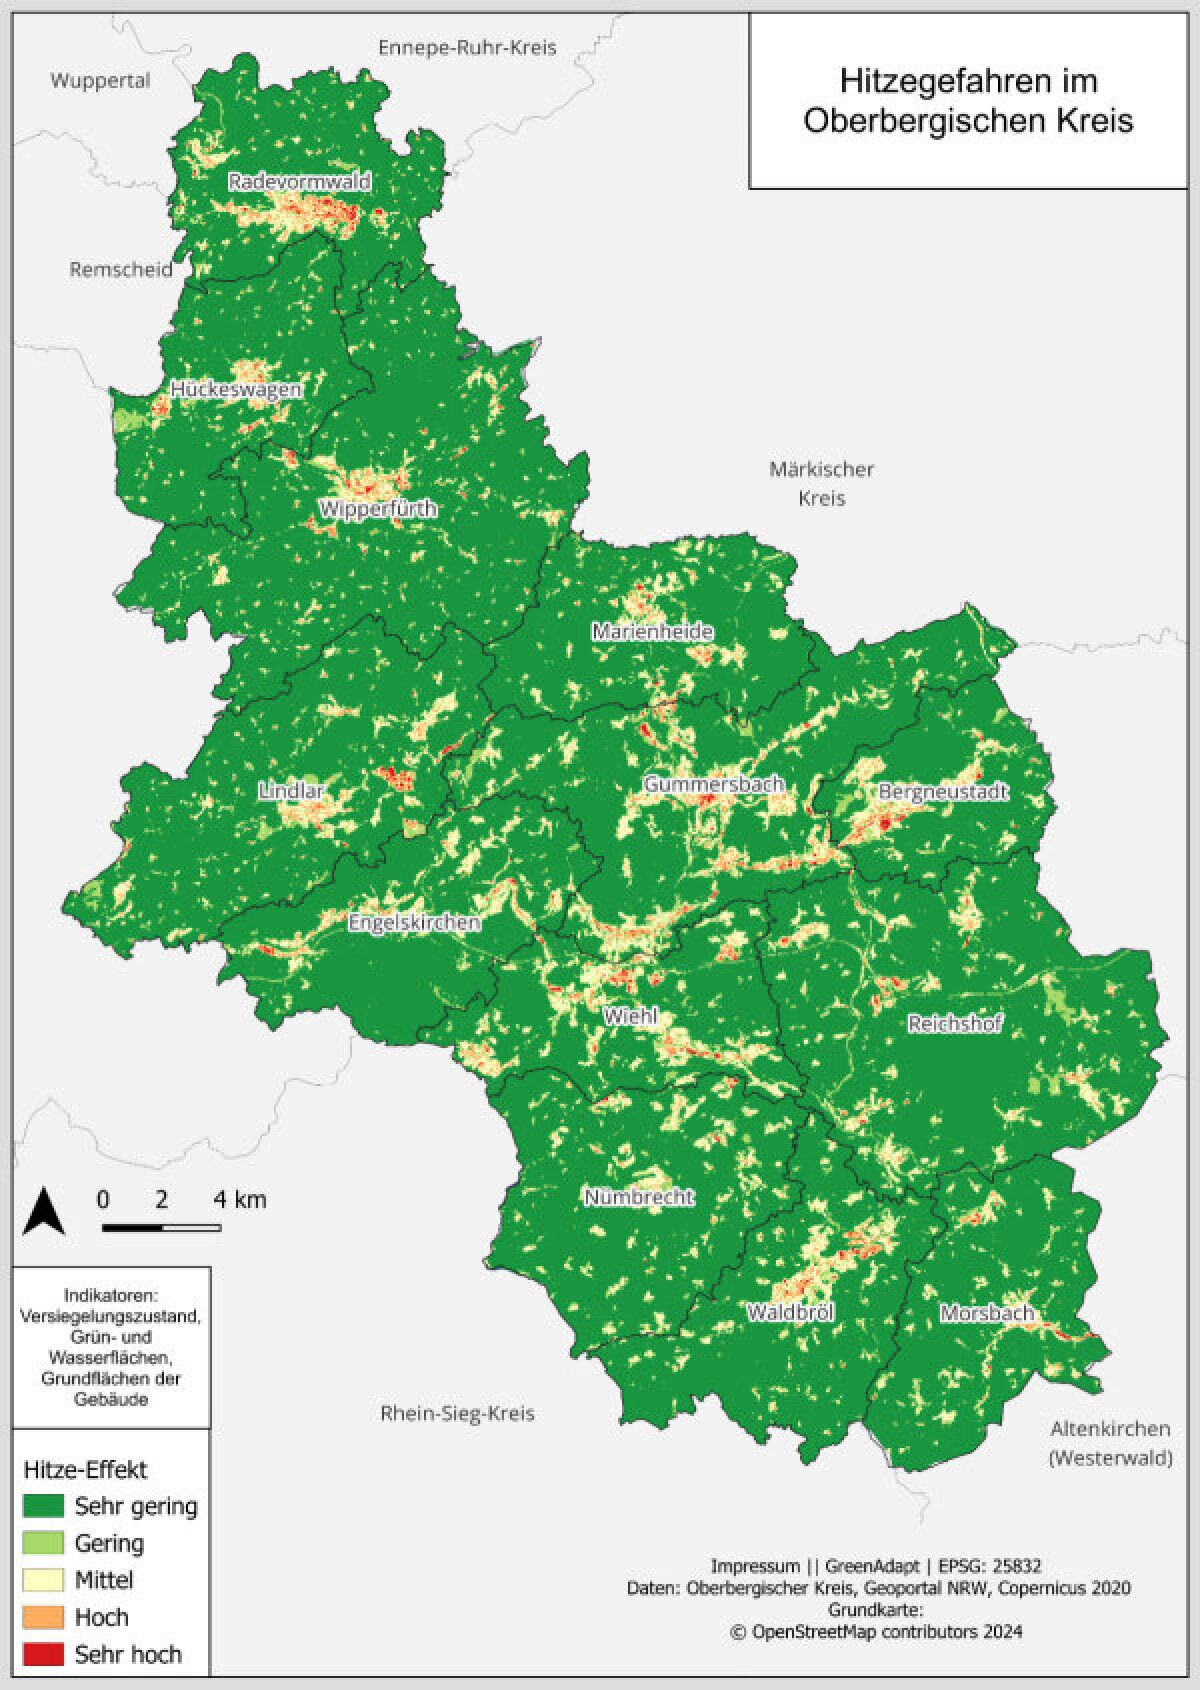
The heat hazard map combines the heat stress risk based on the degree of sealing, building density, and the proportion of green and water areas.
Green areas indicate low heat stress risk, while red areas indicate high heat stress risk.
The highest heat stress is evident in densely built-up town centers and some industrial areas. In these areas, summer heat phases, particularly during the night, will be most pronounced and lead to higher heat stress.
RIO Map Heat Hazards Oberbergischer Kreis
Heat map: OBK, Basemap © GeoBasis-DE / BKG (2026) dl-de/by-2-0)
Directly to RIO
Cold Air Volume Flow
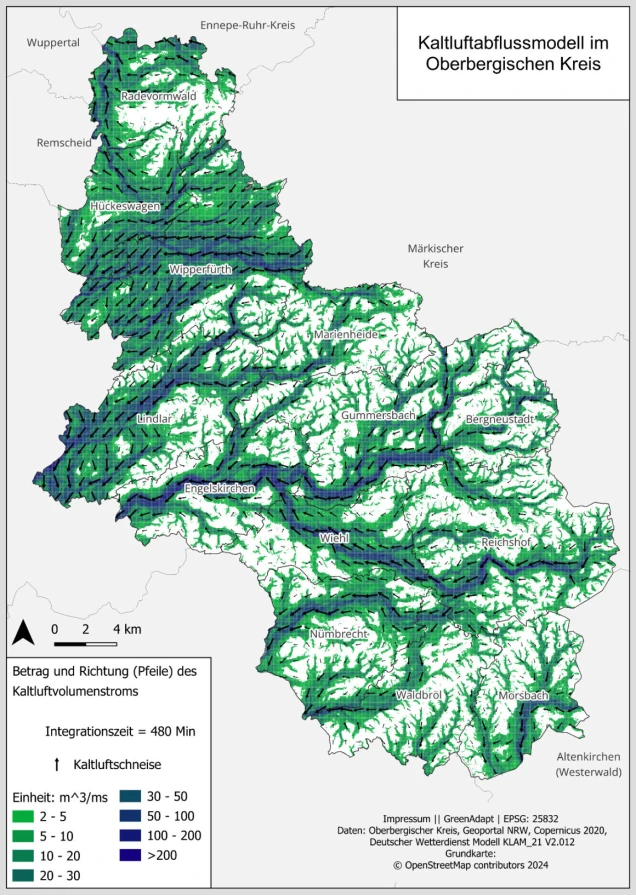
The Oberbergischer Kreis is an area where, due to the forests, the many agriculturally used meadows and pastures, as well as the topographical structure, comparatively large amounts of cold air are generated at night and flow through the Oberbergischer Kreis towards the Rhine corridor.
Through these cold air corridors, which are primarily located in the large river valleys, significant amounts of fresh and cold air are transported over long distances.
It is also important on a smaller scale not to disrupt these cold air corridors to ensure that towns and industrial areas in the Oberbergischer Kreis are supplied with nocturnal cold air.
The depicted map shows the result of a district-wide simulation using the KLAM_21 software of the German Weather Service, which calculates nocturnal cold air generation based on terrain elevations and land use information with a resolution of 30 meters.
RIO Map Cold Air Flow Volume Oberbergischer Kreis
Cold air flow volume map: OBK, Basemap © GeoBasis-DE / BKG (2026) dl-de/by-2-0)
Directly to RIO
Cold Air Formation Areas
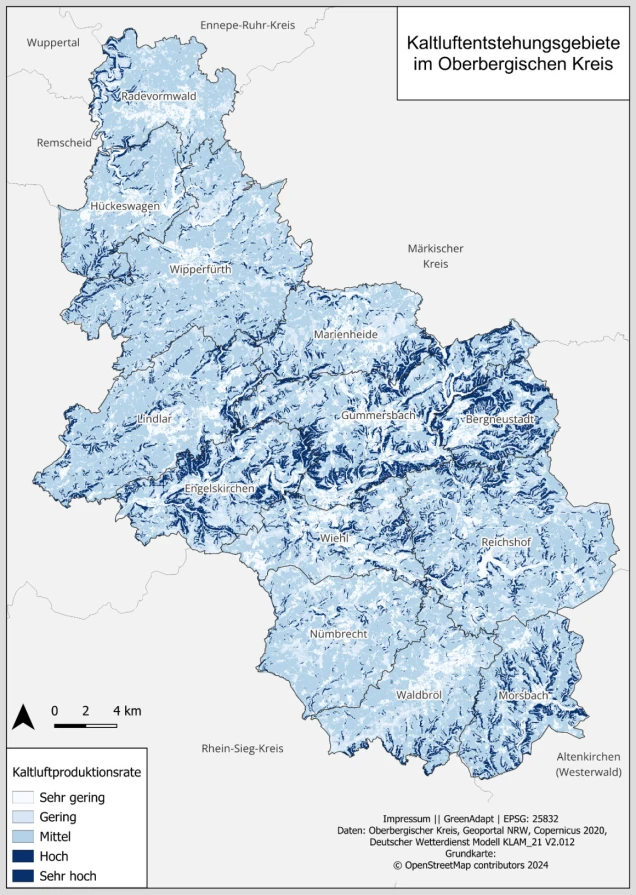
The map of cold air generation areas shows in detail where exactly the areas that are particularly important for nocturnal cold air formation are located.
These are primarily valley meadows, forest edges, slopes, and open agricultural areas that should be protected from negative influences and given special consideration in case of land use changes in the outer areas.
Cold air generated in the Oberbergischer Kreis, which flows through it into the densely populated areas southwest of the district, is particularly significant for the regions of the Rhein-Sieg-Kreis, the Rheinisch-Bergischer Kreis, as well as for the Cologne agglomeration area.
This supraregional significance must continue to be protected and preserved to provide these regions with a basis for climate adaptation to summer heat waves.
RIO Map Cold Air Generation Areas Oberbergischer Kreis
Cold air generation map: OBK, Basemap © GeoBasis-DE / BKG (2026) dl-de/by-2-0)
Directly to RIO
Contact
Climate Change Adaptation Concept
Thomas Groos