 copyright: Gerd Altmann / pixabay
Climate
This page was translated from German using artificial intelligence. The translation may contain errors or inaccuracies. In case of doubt, the German original version prevails.
Climate Change
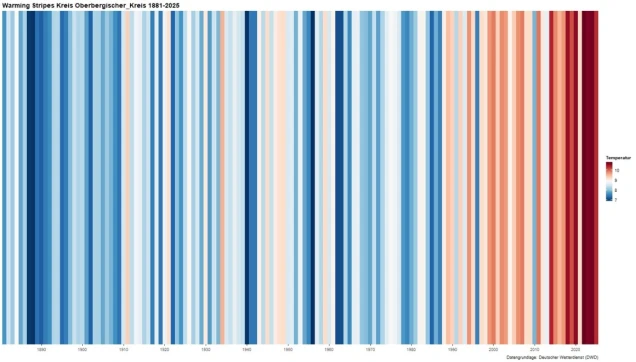
Our climate is changing. It is becoming warmer, springs and summers are becoming drier, and winters are becoming wetter. The temperature stripes for the Oberbergischer Kreis over the average annual temperature since 1881 illustrate this impressively.
Extreme weather events such as heavy rainfall and heat waves are also occurring more frequently and intensely in the Oberbergischer Kreis.
Climate Protection
Climate protection measures ensure that we preserve our natural resources and limit the effects of global warming.
Climate Change Adaptation
The term climate change adaptation describes measures that help us better cope with the unavoidable consequences of climate change and minimize the impacts on health, biodiversity, or the economy.
In the program Climate-Environment-Nature-Oberberg (KUNO), the Oberbergischer Kreis summarizes its measures for climate protection, climate change adaptation, and the promotion of habitat and biodiversity.
Further Topics on Climate Protection
Climate Change Adaptation
Further topics on climate change adaptation
Contact
Coordination Climate-Environment-Nature-Oberberg
Thomas Groos